Debugging
Developing APIs, especially for Machine Learning, is rarely a linear path. It is a cycle of writing code, testing it, encountering unexpected behaviours, and fixing them. Debugging (the art of identifying and resolving these issues) can be particularly challenging in asynchronous environments where stack traces can be complex and errors might be buried deep within a dependency chain.
Standard logging is essential, but it often forces you to dig through text files or console output to reconstruct the state of your application at the moment of failure. Flama aims to improve this developer experience by providing interactive, graphical debugging tools directly in your browser. These tools allow you to inspect code errors (Internal Server Errors) and resolve routing issues (Not Found errors) with significantly less friction than traditional methods.
Developer mode
Flama includes a dedicated "Developer Mode" (debug mode) designed specifically for the development phase of your project. When enabled, the framework swaps out the standard, production-safe error handlers for rich, interactive diagnostic pages.
Instead of receiving a generic 500 Internal Server Error JSON response when your code crashes, you are presented with a full stack trace that lets you inspect variables at every level of execution. Instead of a blank 404 Not Found response when you mistype a URL, you see a helpful list of every valid route currently registered in your application.
Security warning
WARNING
Never enable Debug Mode in Production
The debug interfaces expose extremely sensitive information about your application, including:
- Source Code: Snippets of your code are displayed in the traceback.
- Environment Variables: Configuration keys and secrets may be visible.
- Local Variables: The exact state of memory (including potentially sensitive user data) is accessible.
Debug mode is a tool for developers, not for users. Ensure that debug=True is strictly disabled in any live, public-facing deployment.
How to enable debug mode
There are several ways to activate debug mode, depending on how you run your application.
Programmatic Activation
When instantiating your application object, you can pass the debug argument. This is the most explicit method and is useful when you are running scripts locally.
from flama import Flama
# Explicitly enable debug modeapp = Flama(debug=True)
Via CLI
If you are using the Flama command-line interface to run your application, you can use the --app-debug flag. This is convenient because it allows you to toggle the mode without changing a single line of your source code.
flama run src.main:app --app-debugVia configuration
Following the principles discussed in the Configuration section, you can also control this setting via environment variables. This is often the safest approach, as it allows you to keep debug=False in your code but override it to True only in your local .env file or development environment.
from flama import Flamafrom flama.config import Config
config = Config()# Load the debug flag from the environment (defaulting to False for safety)is_debug = config("DEBUG", cast=bool, default=False)
app = Flama(debug=is_debug)
Debug interface
Once enabled, Flama automatically intercepts specific HTTP error status codes to provide better context.
Handling Crashes - 500 Internal Server Error
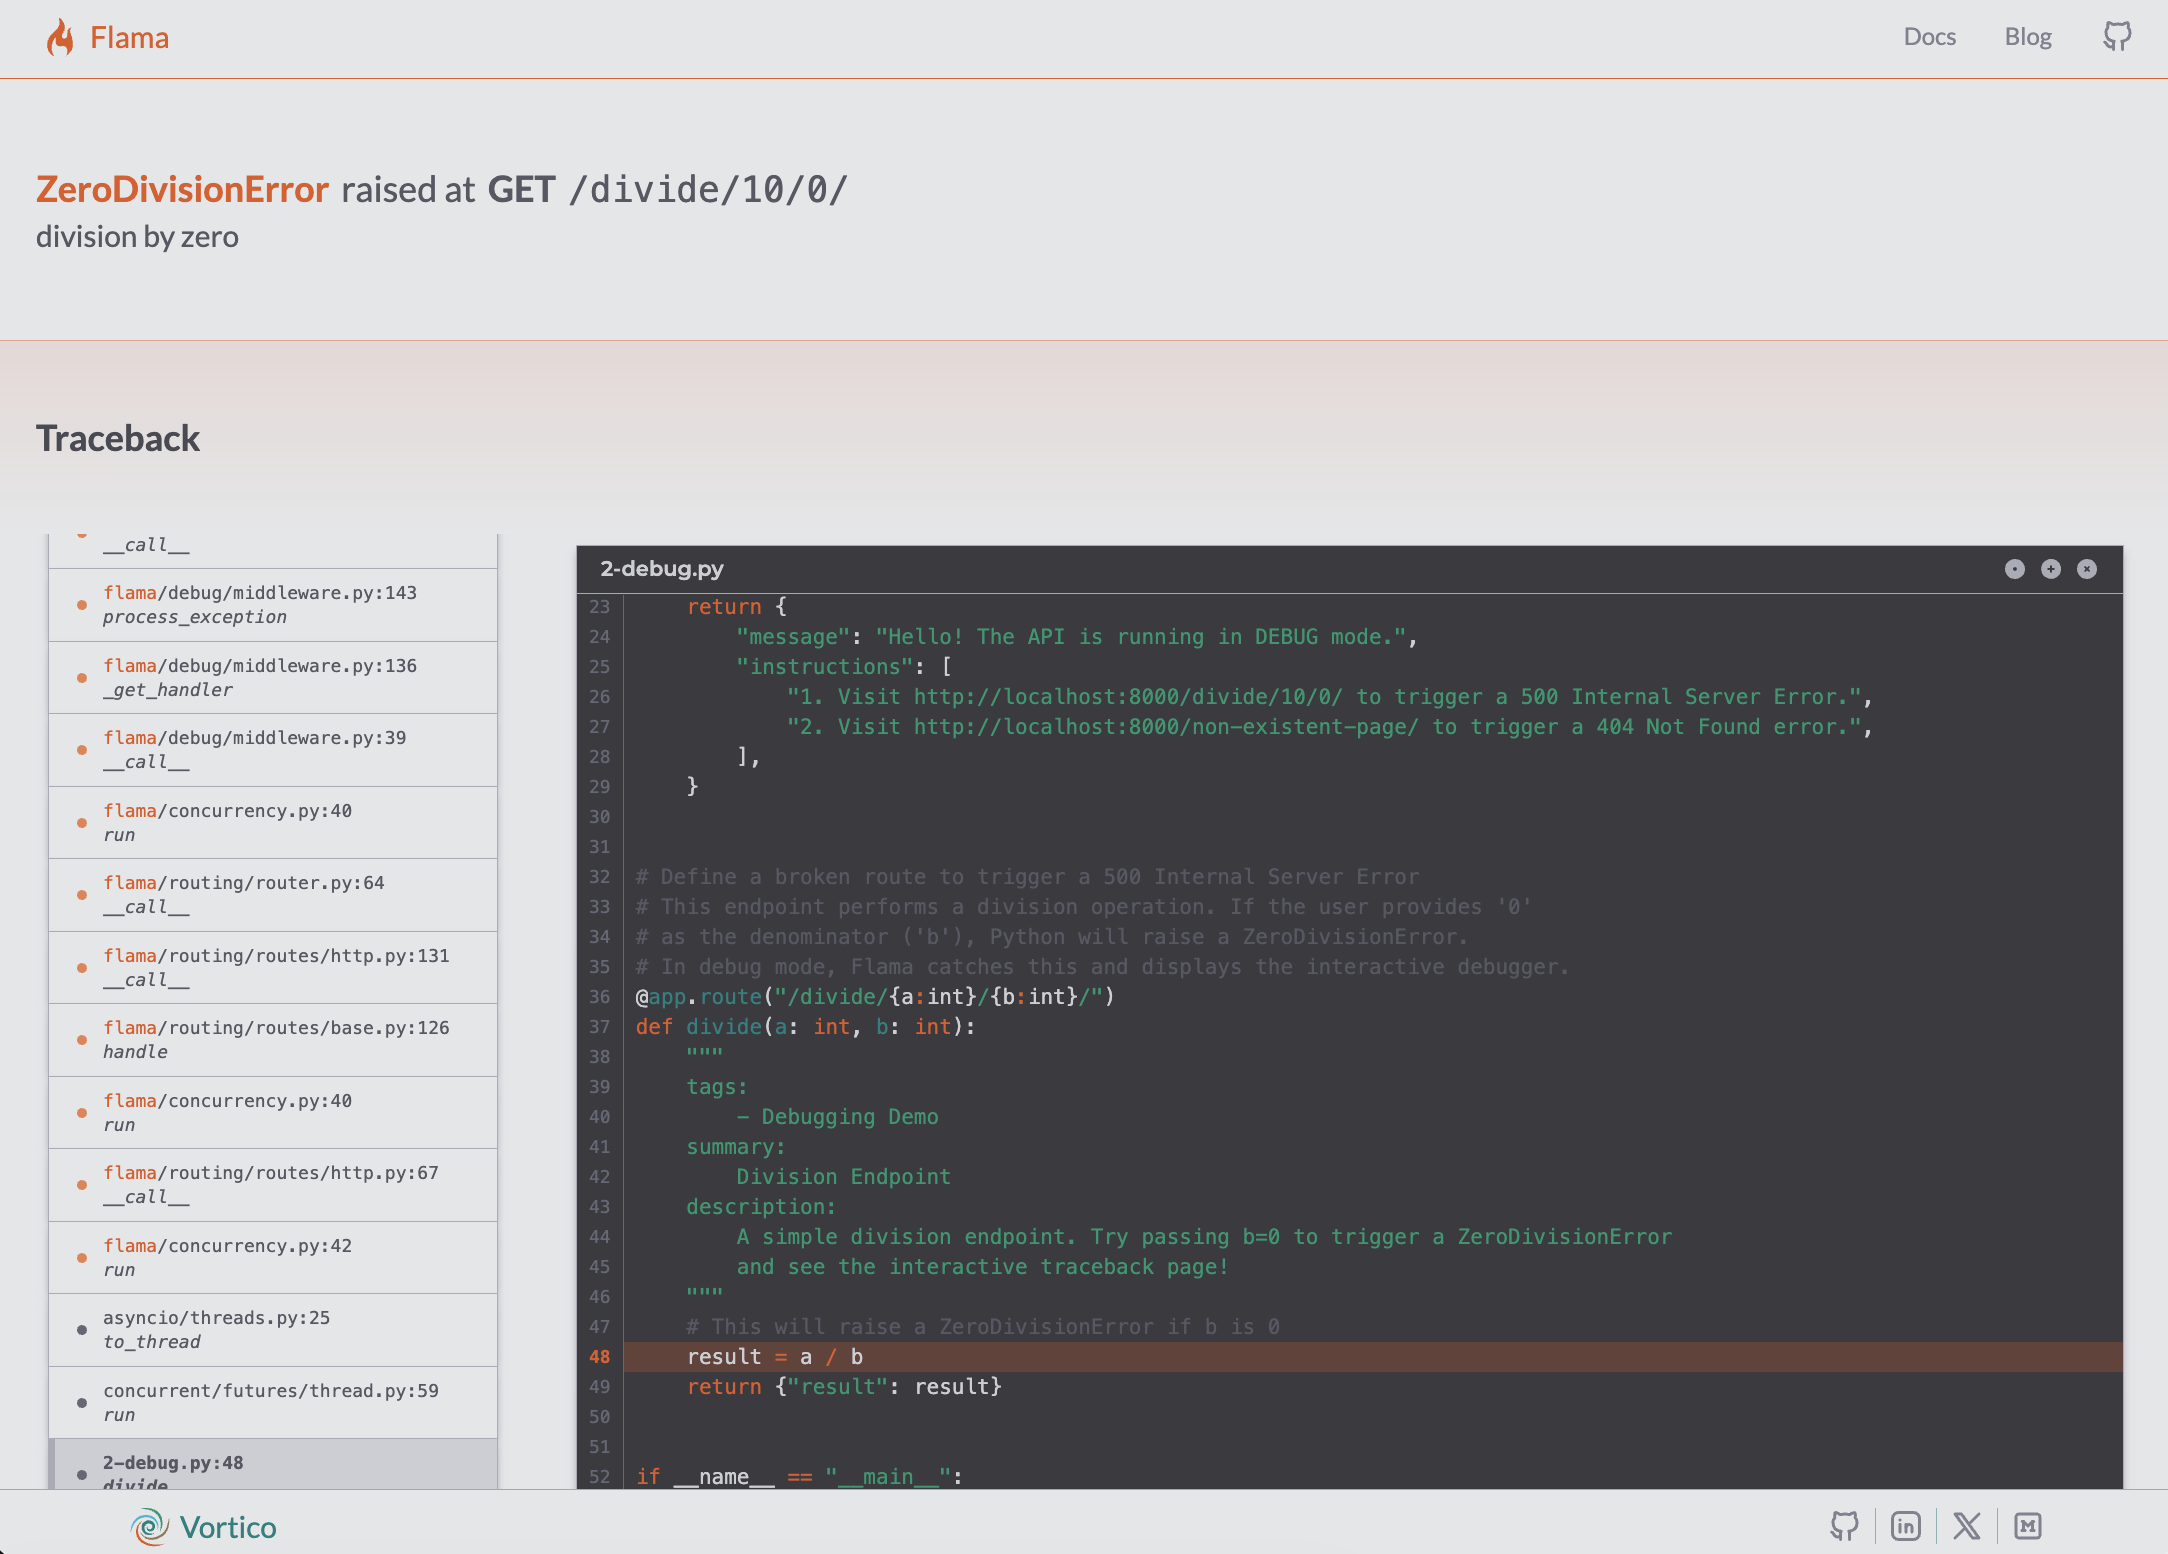
When an unhandled exception occurs in your code, for example a ZeroDivisionError or a database connection failure,
Flama catches it and renders an Interactive Traceback.
This page visualises the call stack from the point of the error all the way back up to the application entry point. Key features include:
- Code Inspection: You can see the exact line of code that triggered the error, along with surrounding lines for context.
- Variable Inspection: You can expand any frame in the stack trace to view the local variables that were present at that moment. This eliminates the need to add
print()statements just to see what a variable held when the crash happened. - Request Details: It displays full details about the incoming request, including headers, query parameters, and client information.
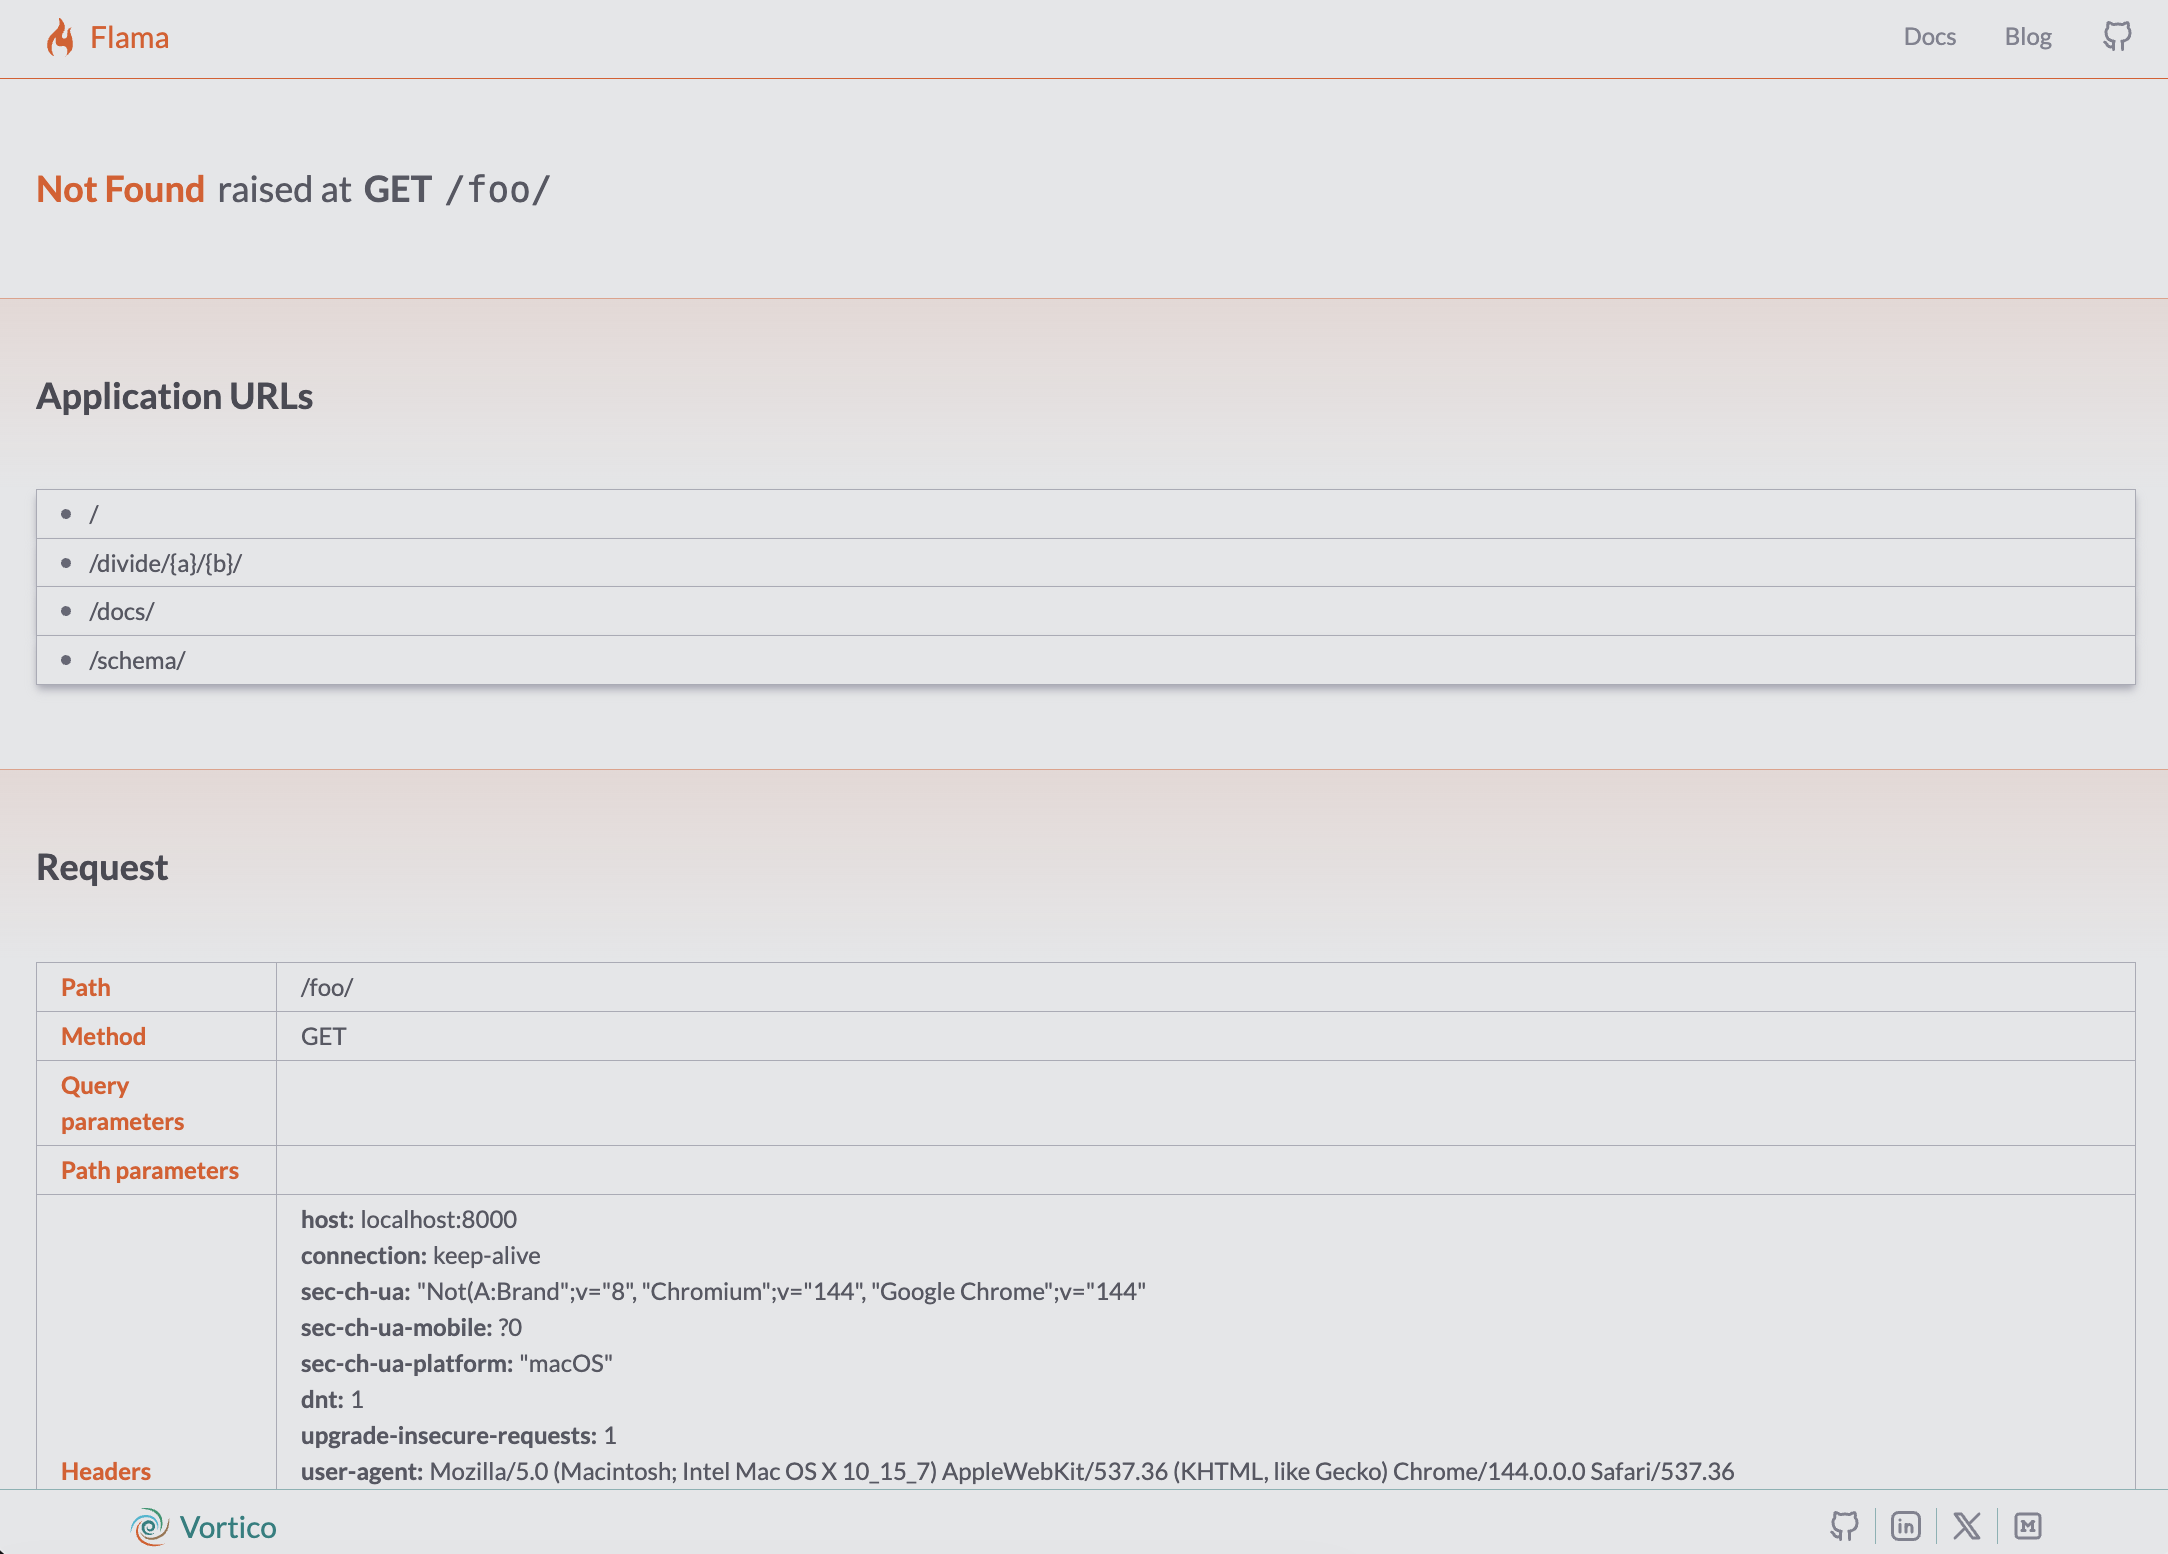
Handling Missing Resources - 404 Not Found
Routing errors can be frustratingly subtle. A missing trailing slash, a regex mismatch in a path parameter, or a simple typo can lead to a generic 404 Not Found error that gives you no clues about why the route wasn't matched.
In debug mode, Flama replaces the standard 404 response with a Route Helper page. This page lists all the routes currently registered in your application. This allows you to:
- Verify that your route was actually registered.
- Compare your requested URL against the valid patterns.
- Spot discrepancies in path parameters (e.g., trying to pass a string to an
{id:int}parameter).
Example
Let's see these tools in action. We will create a simple application that is intentionally buggy to demonstrate how Flama helps you diagnose issues.
Save the following code as debugging_example.py.
It defines a basic homepage and a "broken" endpoint that performs division.
import flamafrom flama import Flama
# Initialize Flama with debug mode enabled# By setting debug=True, Flama replaces the standard error handlers with# interactive debugging tools. This allows you to inspect variables and# stack traces directly in the browser when an exception occurs.# WARNING: Never enable this in a production environment!app = Flama(debug=True)
# Define a standard route@app.route("/")def home():    """    tags:        - Home    summary:        Home Page    description:        A simple endpoint to verify the server is running.    """    return {        "message": "Hello! The API is running in DEBUG mode.",        "instructions": [            "1. Visit http://localhost:8000/divide/10/0/ to trigger a 500 Internal Server Error.",            "2. Visit http://localhost:8000/non-existent-page/ to trigger a 404 Not Found error.",        ],    }
# Define a broken route to trigger a 500 Internal Server Error# This endpoint performs a division operation. If the user provides '0'# as the denominator ('b'), Python will raise a ZeroDivisionError.# In debug mode, Flama catches this and displays the interactive debugger.@app.route("/divide/{a:int}/{b:int}/")def divide(a: int, b: int):    """    tags:        - Debugging Demo    summary:        Division Endpoint    description:        A simple division endpoint. Try passing b=0 to trigger a ZeroDivisionError        and see the interactive traceback page!    """    # This will raise a ZeroDivisionError if b is 0    result = a / b    return {"result": result}
if __name__ == "__main__":    flama.run(flama_app=app, server_host="0.0.0.0", server_port=8000)
Run the application:
python debugging_example.pyInternal Server Error
Open your browser and navigate to:
http://localhost:8000/divide/10/0/
In a normal application, you would simply see {"error": "Internal Server Error"}.
However, because debug=True, you will see the Interactive Traceback.
- Look at the top of the page: It clearly states
ZeroDivisionError: division by zero. - Scroll through the stack trace. Find the frame corresponding to the
dividefunction indebugging_example.py. - Click on that frame to expand it. You will see the local variables
a=10andb=0, confirming exactly why the operation failed.
Not Found
Now, try to visit a page that doesn't exist:
http://localhost:8000/foo/
Instead of a blank error, you will see the Not Found helper page:
- It clearly states
404 Not Found. - Below the error, you will see a list of Available Routes.
- You can see that
/divide/{a:int}/{b:int}/is available, but/foo/is not. This immediate feedback loop helps you catch routing configuration errors instantly.
Conclusion
Debugging mode is a powerful productivity booster for developing Flama applications. By providing immediate, graphical insight into errors and routing configuration, it drastically reduces the time spent diagnosing issues. Remember to treat it as a development-only tool, ensuring it is disabled in production to keep your application secure.